In this blog post, we will learn how to ingest VPC flow logs with additional meta-data to Splunk. We will start by creating a VPC flow logs using terraform and pushing the logs to S3. From S3 ingesting these logs to Splunk using Amazon Kinesis. At last, we will make some changes to Splunk’s profs.conf file for correct field extraction for the additional VPC flow log fields.
All Terraform files are available to download at my GitHub Repo. You just need to edit the terraform.tfvars file and put your AWS ACCESS KEY ID and SECRET ACCESS KEY.
maven@pluto:~$ tree ./terraform/
./terraform/
├── cloudtrail.tf
├── module.tf
├── output.tf
├── provider.tf
├── splunk
│   ├── instance_splunk.tf
│   ├── splunk_iam_role.tf
│   ├── splunk_iam_role_pol.json
│   ├── user_data_splunk.sh
|   ├── sqs_vpc_flow_logs.tf
│   ├── variables.tf
|   ├── vpc_flow_log.tf
│   └── vpc_splunk.tf
├── sqs_cloudtrail_logs.tf
├── terraform.tfvars
├── variables.tf
└── versions.tf
In our previous post, we setup a Splunk environment on AWS using Splunk Enterprise. To the same exisitng infrastructure, we added few things to achieve our today’s task. Terrafrom file vpc_flow_log.tf and sqs_vpc_flow_logs.tf in addition to our earlier AWS infrastructure.
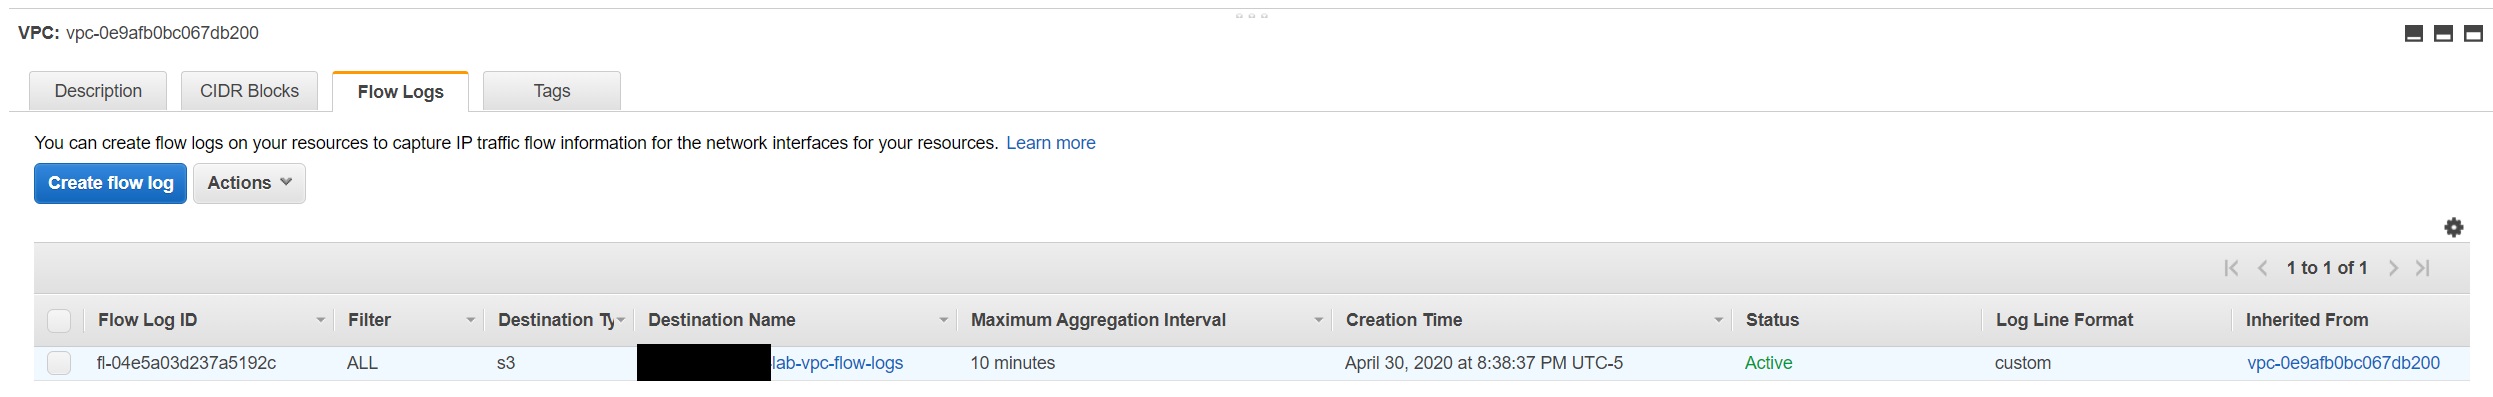
Create a VPC Flow log for the existing Splunk VPC
VPC Flow Logs is a feature that enables you to capture information about the IP traffic going to and from network interfaces in your VPC.
Default VPC Flow Log format
<version> <account-id> <interface-id> <srcaddr> <dstaddr> <srcport> <dstport> <protocol> <packets> <bytes> <start> <end> <action> <log-status>
But we will creating a custom format for the flow log record using additonal meta-data fields. This helps us to create flow logs that are specific to our needs, you can add or omit the fields based on your requirements. We will be adding all the available fields for this demo. Additonal fields like instance-id makes an analyst’s life much easier during investigation to find the actual source, instead of just relying on srcaddr, as EC2 instances are ephermal in nature, source address/private IP address can later be assigned to a different instance.
<version> <vpc-id> <subnet-id> <instance-id> <interface-id> <account-id> <type> <srcaddr> <dstaddr>
  <srcport> <dstport> <pkt-srcaddr> <pkt-dstaddr> <protocol> <bytes> <packets> <start> <end> <action> <tcp-flags> <log-status>
# Flow Logs for the Splunk VPC
resource "aws_flow_log" "splunk_vpc_flow_log" {
  log_destination          = aws_s3_bucket.flow_log_bucket.arn
  log_destination_type     = "s3"
  traffic_type             = "ALL"
  vpc_id                   = aws_vpc.splunk_vpc.id
  log_format               = "$${version} $${vpc-id} $${subnet-id} $${instance-id} $${interface-id} $${account-id} $${type} $${srcaddr} $${dstaddr}
   $${srcport} $${dstport} $${pkt-srcaddr} $${pkt-dstaddr} $${protocol} $${bytes} $${packets} $${start} $${end} $${action} $${tcp-flags} $${log-status}"
  max_aggregation_interval = "600"
}
Please note, a resource-based policy will be created for you and attached to the target bucket.
Create an Amazon S3 bucket for our VPC Flow Logs.
# S3 bucket for VPC Flow logs
resource "aws_s3_bucket" "flow_log_bucket" {
  bucket = "${var.account_id}-lab-vpc-flow-logs"
}

output "splunk_vpc_log_id" {
  description = "The Flow Log ID"
  value       = aws_flow_log.splunk_vpc_flow_log.id
}
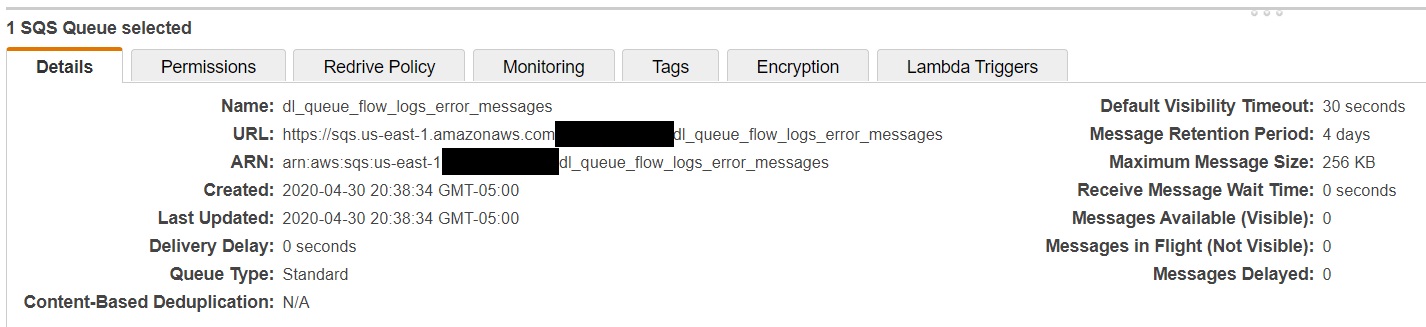
Create two SQS Queues.
Now it’s time to create the SQS queues. Two queues will be required. One queue will be the dead letter queue for error messages to be kicked over to and the other will be the queue used to capture the S3 notifications when a new VPC Flow Log event is sent to the S3 bucket we created in earlier step.
# Add Amazon S3 Event Notification configuration to SQS Queue
resource "aws_sqs_queue" "queue_flow_logs" {
  name                       = "s3_event_notification_queue_flow_logs"
  visibility_timeout_seconds = 300
  redrive_policy = jsonencode({
    deadLetterTargetArn = aws_sqs_queue.dl_queue_flow_logs.arn
    maxReceiveCount     = 1
  })

  policy = <<POLICY
{
  "Version": "2012-10-17",
  "Statement": [
    {
      "Effect": "Allow",
      "Principal": "*",
      "Action": "sqs:SendMessage",
      "Resource": "arn:aws:sqs:*:*:s3_event_notification_queue_flow_logs",
      "Condition": {
        "ArnEquals": { "aws:SourceArn": "${aws_s3_bucket.flow_log_bucket.arn}" }
      }
    }
  ]
}
POLICY
}

# Set up a dead-letter queue for the SQS queue to be used for the input for storing invalid messages
resource "aws_sqs_queue" "dl_queue_flow_logs" {
  name = "dl_queue_flow_logs_error_messages"
}

resource "aws_s3_bucket_notification" "bucket_notification" {
  bucket = aws_s3_bucket.flow_log_bucket.id

  queue {
    queue_arn = aws_sqs_queue.queue_flow_logs.arn
    events    = ["s3:ObjectCreated:*"]
  }
}

output "sqs_arn" {
  description = "The ARN of the SQS queue"
  value       = aws_sqs_queue.queue_flow_logs.arn
}
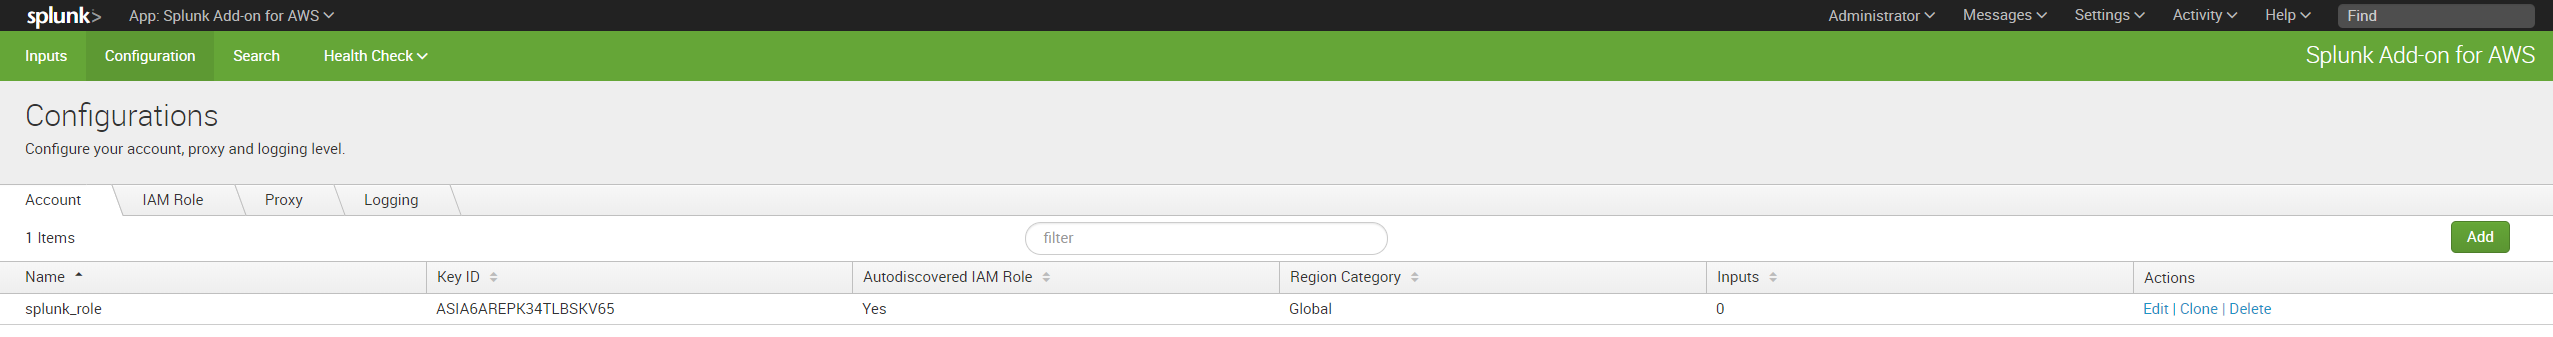
Configure Splunk Add-on for VPC Flow logs
In our previous post, we already setup the splunk environment by installing these two apps.
If you haven’t already done so, I would suggest please follow the steps 8-13 on previous post
Next, we need to update the props.conf file on Splunk Search Head for the AWS Add-on app. Location of props.conf will be located at $SPLUNK_HOME/etc/apps/SPLUNK_TA_aws/default/props.conf
Before
##################################
###    AWS CloudWatch Logs     ###
##################################

[aws:cloudwatchlogs:vpcflow]
SHOULD_LINEMERGE = false
EXTRACT-all=^\s*(\d{4}-\d{2}-\d{2}.\d{2}:\d{2}:\d{2}[.\d\w]*)?\s*(?P<version>[^\s]+)\s+(?P<account_id>[^\s]+)\s+(?P<interface_id>[^\s]+)\s+(?P<src_ip>[^\s]+)
 \s+(?P<dest_ip>[^\s]+)\s+(?P<src_port>[^\s]+)\s+(?P<dest_port>[^\s]+)\s+(?P<protocol_code>[^\s]+)\s+(?P<packets>[^\s]+)\s+(?P<bytes>[^\s]+)\s+(?P<start_time>[^\s]+)
 \s+(?P<end_time>[^\s]+)\s+(?P<vpcflow_action>[^\s]+)\s+(?P<log_status>[^\s]+)
After
##################################
###    AWS CloudWatch Logs     ###
##################################

[aws:cloudwatchlogs:vpcflow]
SHOULD_LINEMERGE = false
EXTRACT-all=^\s*(\d{4}-\d{2}-\d{2}.\d{2}:\d{2}:\d{2}[.\d\w]*)?\s*(?P<version>[^\s]+)\s+(?P<vpc_id>[^\s]+)\s+(?P<subnet_id>[^\s]+)\s+(?P<instance_id>[^\s]+)
 \s+(?P<interface_id>[^\s]+)\s+(?P<account_id>[^\s]+)\s+(?P<type>[^\s]+)\s+(?P<src_ip>[^\s]+)\s+(?P<dest_ip>[^\s]+)\s+(?P<src_port>[^\s]+)\s+(?P<dest_port>[^\s]+)
 \s+(?P<pkt_srcaddr>[^\s]+)\s+(?P<pkt_dstaddr>[^\s]+)\s+(?P<protocol_code>[^\s]+)\s+(?P<bytes>[^\s]+)\s+(?P<packets>[^\s]+)\s+(?P<start_time>[^\s]+)\s+(?P<end_time>[^\s]+)
 \s+(?P<vpcflow_action>[^\s]+)\s+(?P<tcp_flags>[^\s]+)(?P<log_status>[^\s]+)
Login to Splunk Instance using the public IP of the EC2 instance
Search for the CloudWatch logs using the SPL:
index=main sourcetype=aws:cloudwatchlogs:vpcflow
| table version vpc_id subnet_id instance_id interface_id account_id type src_ip dest_ip src_port dest_port pkt_srcaddr pkt_dstaddr protocol_code bytes
 packets start_time end_time vpcflow_action tcp_flags log_status
Summary: In this post, we ingested custom VPC flow logs to splunk and configured Splunk TA to correctly parse those logs. Questions and suggestions are welcome. Happy Learning.